Combined location graph
Graph a single data type with up to the last 120 days of data for multiple monitoring locations
Link will open a new tab and prepopulate the graph with data for this monitoring location and current primary data type. Add additional locations on the Combined location graph page.
All Continuous data graphs
On a single page, view graphs for each data type that has collected Continuous data at this monitoring location in the last 120 days.
Link will open a new tab to a page with graphs for all data types, sampling methods, and sub-locations at this location returning data within a selected time span

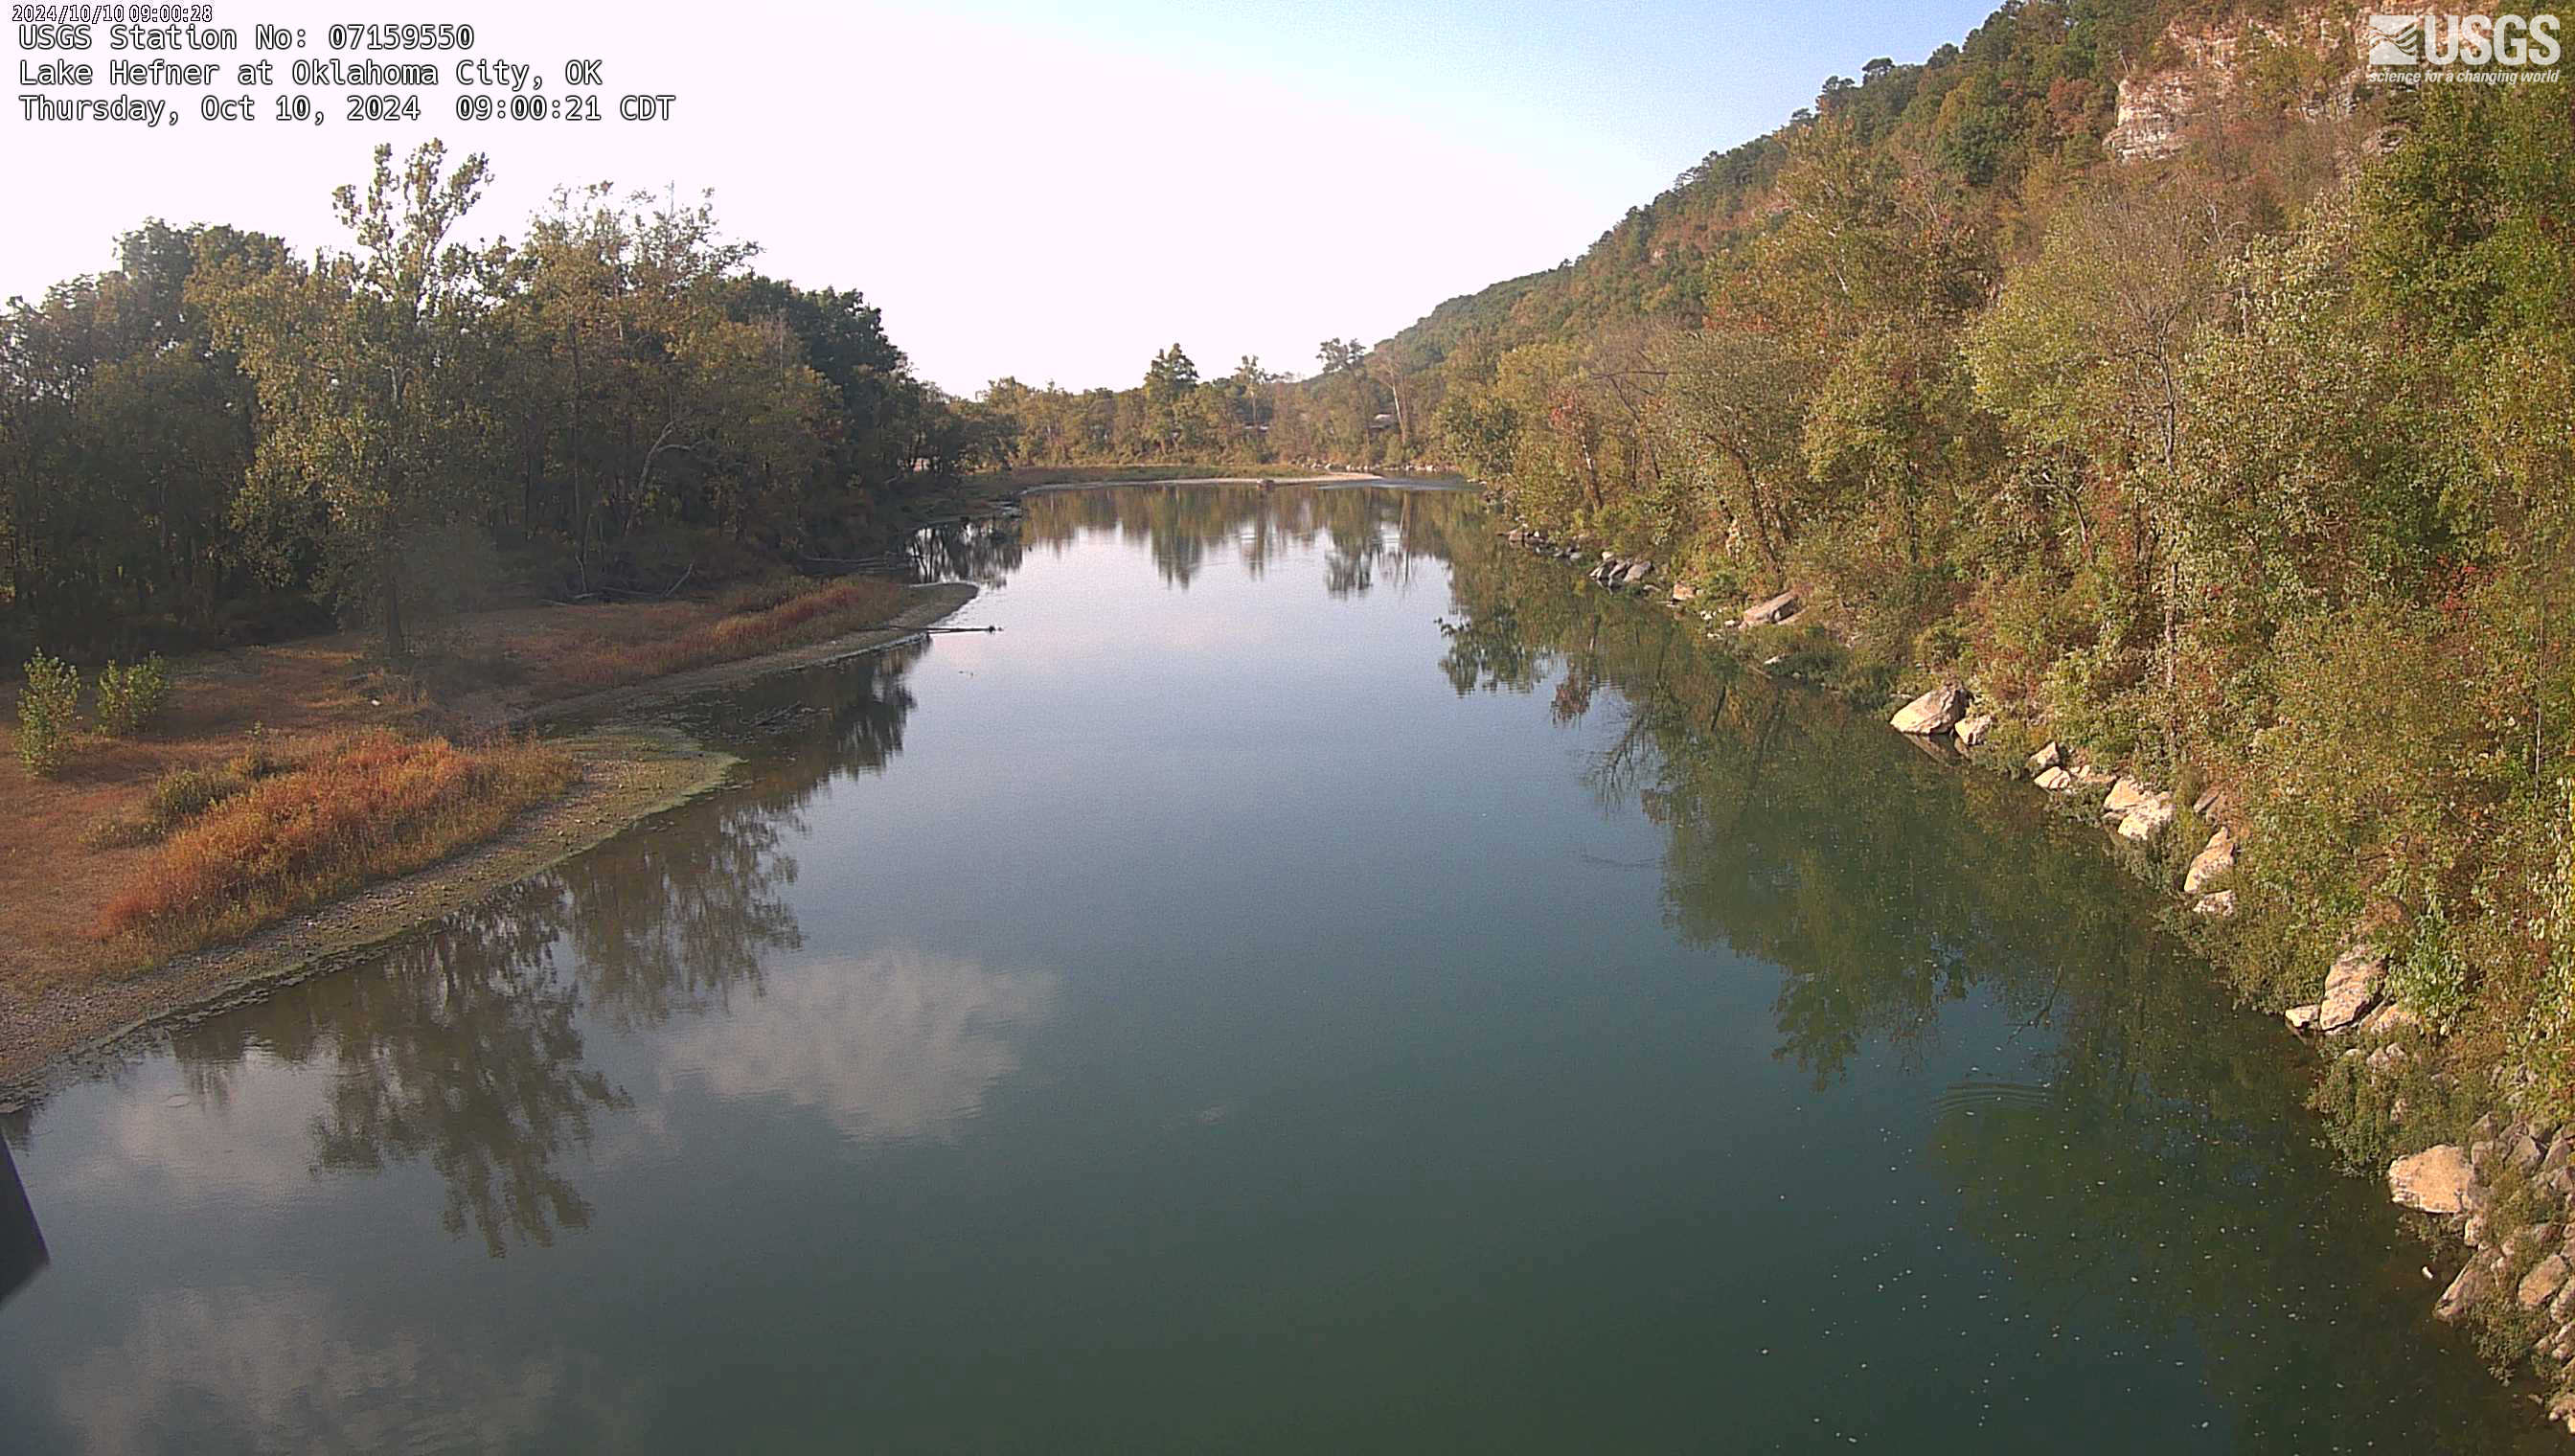
 View more imagery information for Lake Hefner at Oklahoma City
 Monitoring Location


